PRODUCT
Design
Content
Publish
Monitoring Results with RD Station: Reports and Metrics to Optimize Strategies
Monitoring Results with RD Station: Reports and Metrics to Optimize Strategies
Monitoring Results with RD Station: Reports and Metrics to Optimize Strategies
Marketing


The success of any digital marketing strategy depends on the ability to measure and adjust actions based on data. RD Station Marketing offers powerful tools to track the performance of campaigns, automations, and lead flows. Analyzing reports and metrics strategically allows you to identify improvement opportunities and maximize ROI (Return on Investment). In this article, we will explore how to monitor results in RD Station and how DaYo Intelligence & Performance, an official partner of RD Station, can help your company get the most out of this information.
1. The Importance of Monitoring Results in Digital Marketing
Monitoring metrics is not just about numbers; it’s about understanding the behavior of leads, identifying what works, and adjusting strategies to achieve better results. Some benefits include:
More Accurate Decisions: Concrete data helps direct efforts to actions that really make an impact.
Resource Optimization: Investing in the most effective strategies saves time and money.
Continuous Monitoring: Allows for quick adjustments to maximize the performance of ongoing campaigns.
2. Key Metrics Available in RD Station
RD Station Marketing offers a range of metrics that cover everything from email performance to lead conversion. Here are some of the most important:
2.1 Conversion Rate
Measures the percentage of visitors or leads who completed an action, such as filling out a form or making a purchase.
Why is it important?
Indicates whether your campaigns are reaching the right audience.
Helps evaluate the efficiency of landing pages and CTAs.
2.2 Open and Click Rate
Open Rate: Measures the percentage of recipients who opened an email.
Click-Through Rate (CTR): Indicates how many clicked on the links within the email.
How to use?
Low rates may indicate that the subject or design of the email needs adjustments.
High rates show that your message is attracting attention.
2.3 Lead Scoring
Scores leads based on their interactions and characteristics.
Benefit: Helps prioritize more qualified contacts for the sales team.
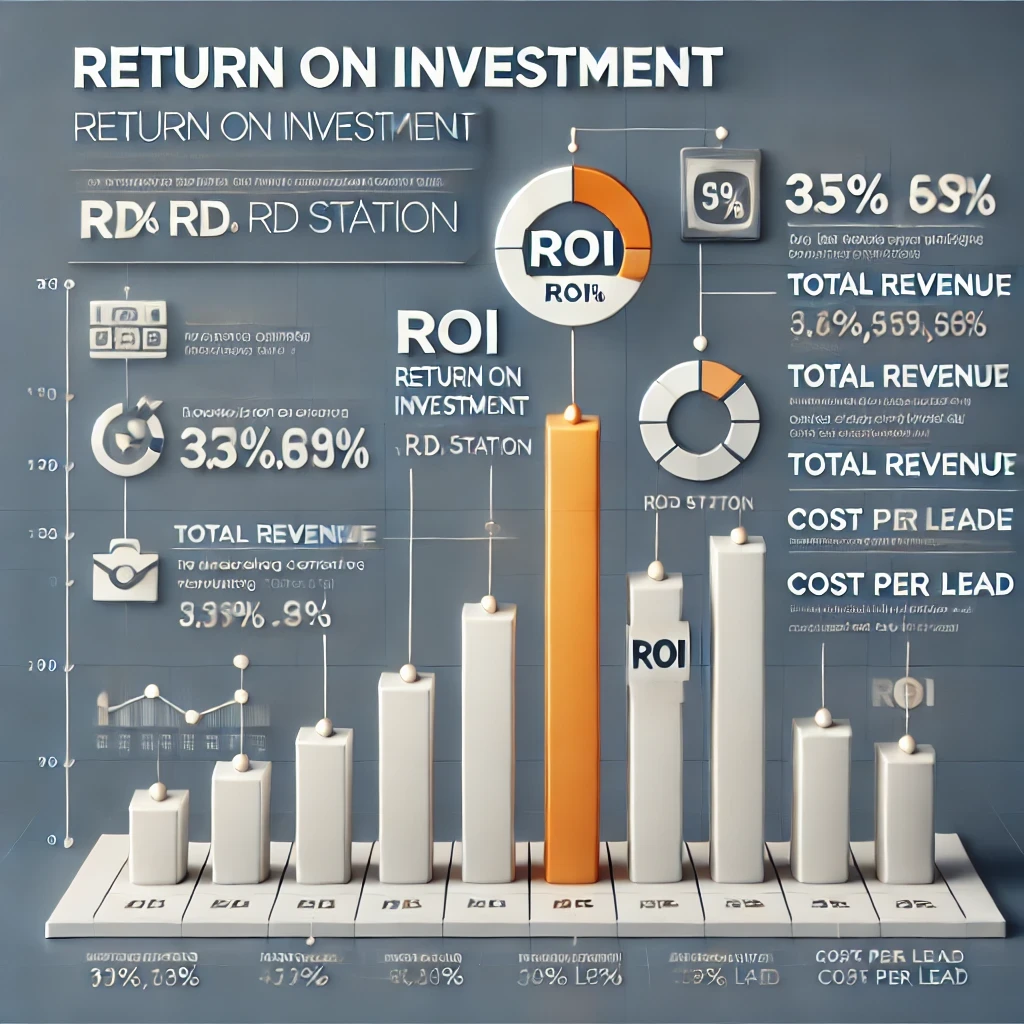
2.4 Return on Investment (ROI)
Measures the profit generated compared to the investment in campaigns.
Why monitor?
Allows identifying channels with the best cost-benefit ratio.
Justifies investments in specific strategies.
3. Exploring the RD Station Reports
RD Station reports provide a comprehensive view of the performance of your campaigns and automations.
3.1 Campaign Reports
Track metrics such as open rates, clicks, and conversions.
Use insights to adjust messaging, targeting, or sending times.
3.2 Automation Reports
Analyze the performance of automated flows:
How many leads completed the flow?
Which steps had more or less engagement?
3.3 Lead Generation Reports
See which channels are bringing in more qualified leads.
Evaluate the cost per lead (CPL) to adjust investments in ads and campaigns.
3.4 Customized Reports
Create customized reports based on the most relevant metrics for your business.
Share data with the team for strategic alignment.
4. How to Analyze Metrics Strategically
Analyzing metrics goes beyond observing numbers; it’s about identifying patterns and transforming them into practical actions.
4.1 Compare Results with Goals
Set clear goals for each campaign (e.g., increase leads by 20%).
Compare the results with the objectives to assess effectiveness.
4.2 Identify Behavior Patterns
See which times, content, or channels generate the most engagement.
Adjust future campaigns based on these insights.
4.3 Test and Optimize
Use A/B testing to identify what works best (e.g., different email subject lines).
Optimize campaigns based on the results of the tests.
5. How DaYo Can Help in Monitoring Results
Analyzing metrics is a continuous process and requires expertise to interpret data and implement effective adjustments. This is where DaYo Intelligence & Performance makes a difference:
Setup of Customized Reports: DaYo creates reports that highlight the most relevant metrics for your business.
Strategic Interpretation: We analyze the data and provide actionable insights to improve your campaigns.
Continuous Optimization: We monitor your campaigns and adjust strategies to maximize ROI.
Want to turn data into results? Talk to DaYo and discover how to monitor and optimize your campaigns in RD Station Marketing!
6. Examples of Adjustments Based on Reports
Case 1: Email Campaigns
Challenge: Low open rate.
Solution: Adjust the email subject and send at alternative times.
Result: 25% increase in open rate.
Case 2: Automation with Low Engagement
Challenge: Many leads abandoning the flow halfway.
Solution: Add incentives, such as valuable materials, in intermediate steps.
Result: 15% increase in flow completion rate.
Case 3: High CPL
Challenge: High cost per lead in paid media campaigns.
Solution: Optimize ads with more precise targeting.
Result: 30% reduction in CPL.
Conclusion
Monitoring results in RD Station Marketing is essential to adjust strategies, optimize resources, and achieve goals more efficiently. With the robust tools of the platform and the strategic support of DaYo Intelligence & Performance, your company can turn data into intelligent decisions and significant results.
Ready to master reports and metrics in RD Station Marketing? Get in touch with DaYo and optimize your strategy today!
You might also like
You might also like


Advanced Strategies with RD Station Marketing: How to Scale Your Campaigns
Advanced Strategies with RD Station Marketing: How to Scale Your Campaigns
Advanced Strategies with RD Station Marketing: How to Scale Your Campaigns
Dec 18, 2024
Marketing
Otávio Luiz


How to Integrate RD Station Marketing with Other Tools to Maximize Results
How to Integrate RD Station Marketing with Other Tools to Maximize Results
How to Integrate RD Station Marketing with Other Tools to Maximize Results
Dec 16, 2024
Marketing
Otávio Luiz


Marketing Automation: Creating Custom Flows in RD Station
Marketing Automation: Creating Custom Flows in RD Station
Marketing Automation: Creating Custom Flows in RD Station
Dec 10, 2024
Marketing
Otávio Luiz


How to Create High-Performance Email Marketing Campaigns with RD Station
How to Create High-Performance Email Marketing Campaigns with RD Station
How to Create High-Performance Email Marketing Campaigns with RD Station
Dec 8, 2024
Marketing
Otávio Luiz
STAY UP TO DATE WITH THE LATEST NEWS. SUBSCRIBE TO OUR NEWSLETTER!

STAY UP TO DATE WITH THE LATEST NEWS. SUBSCRIBE TO OUR NEWSLETTER!

STAY UP TO DATE WITH THE LATEST NEWS. SUBSCRIBE TO OUR NEWSLETTER!
DAYO INTELLIGENCE AND PERFORMANCE
Avenida Paulista, 1106 Bela Vista
São Paulo - SP, 01310-914
Dayo Intelligence and Performance Ltd.
CNPJ: 57.516.832/0001-82
Copyright DaYo Intelligence and Performance 2024
DAYO INTELLIGENCE
AND PERFORMANCE
Avenida Paulista, 1106 Bela Vista
São Paulo - SP, 01310-914
Dayo Intelligence and Performance Ltd.
CNPJ: 57.516.832/0001-82
Copyright DaYo Intelligence and
Performance 2023
DAYO INTELLIGENCE AND PERFORMANCE
Avenida Paulista, 1106 Bela Vista
São Paulo - SP, 01310-914
Dayo Intelligence and Performance Ltd.
CNPJ: 57.516.832/0001-82
Copyright DaYo Intelligence and Performance 2024

